Create a comprehensive prediction dashboard allowing stores to forecast customer flow, compare predictions with actual data, and manage exceptions for effective restaurant and canteen operations.
Objective, scope & deliveables
Scope
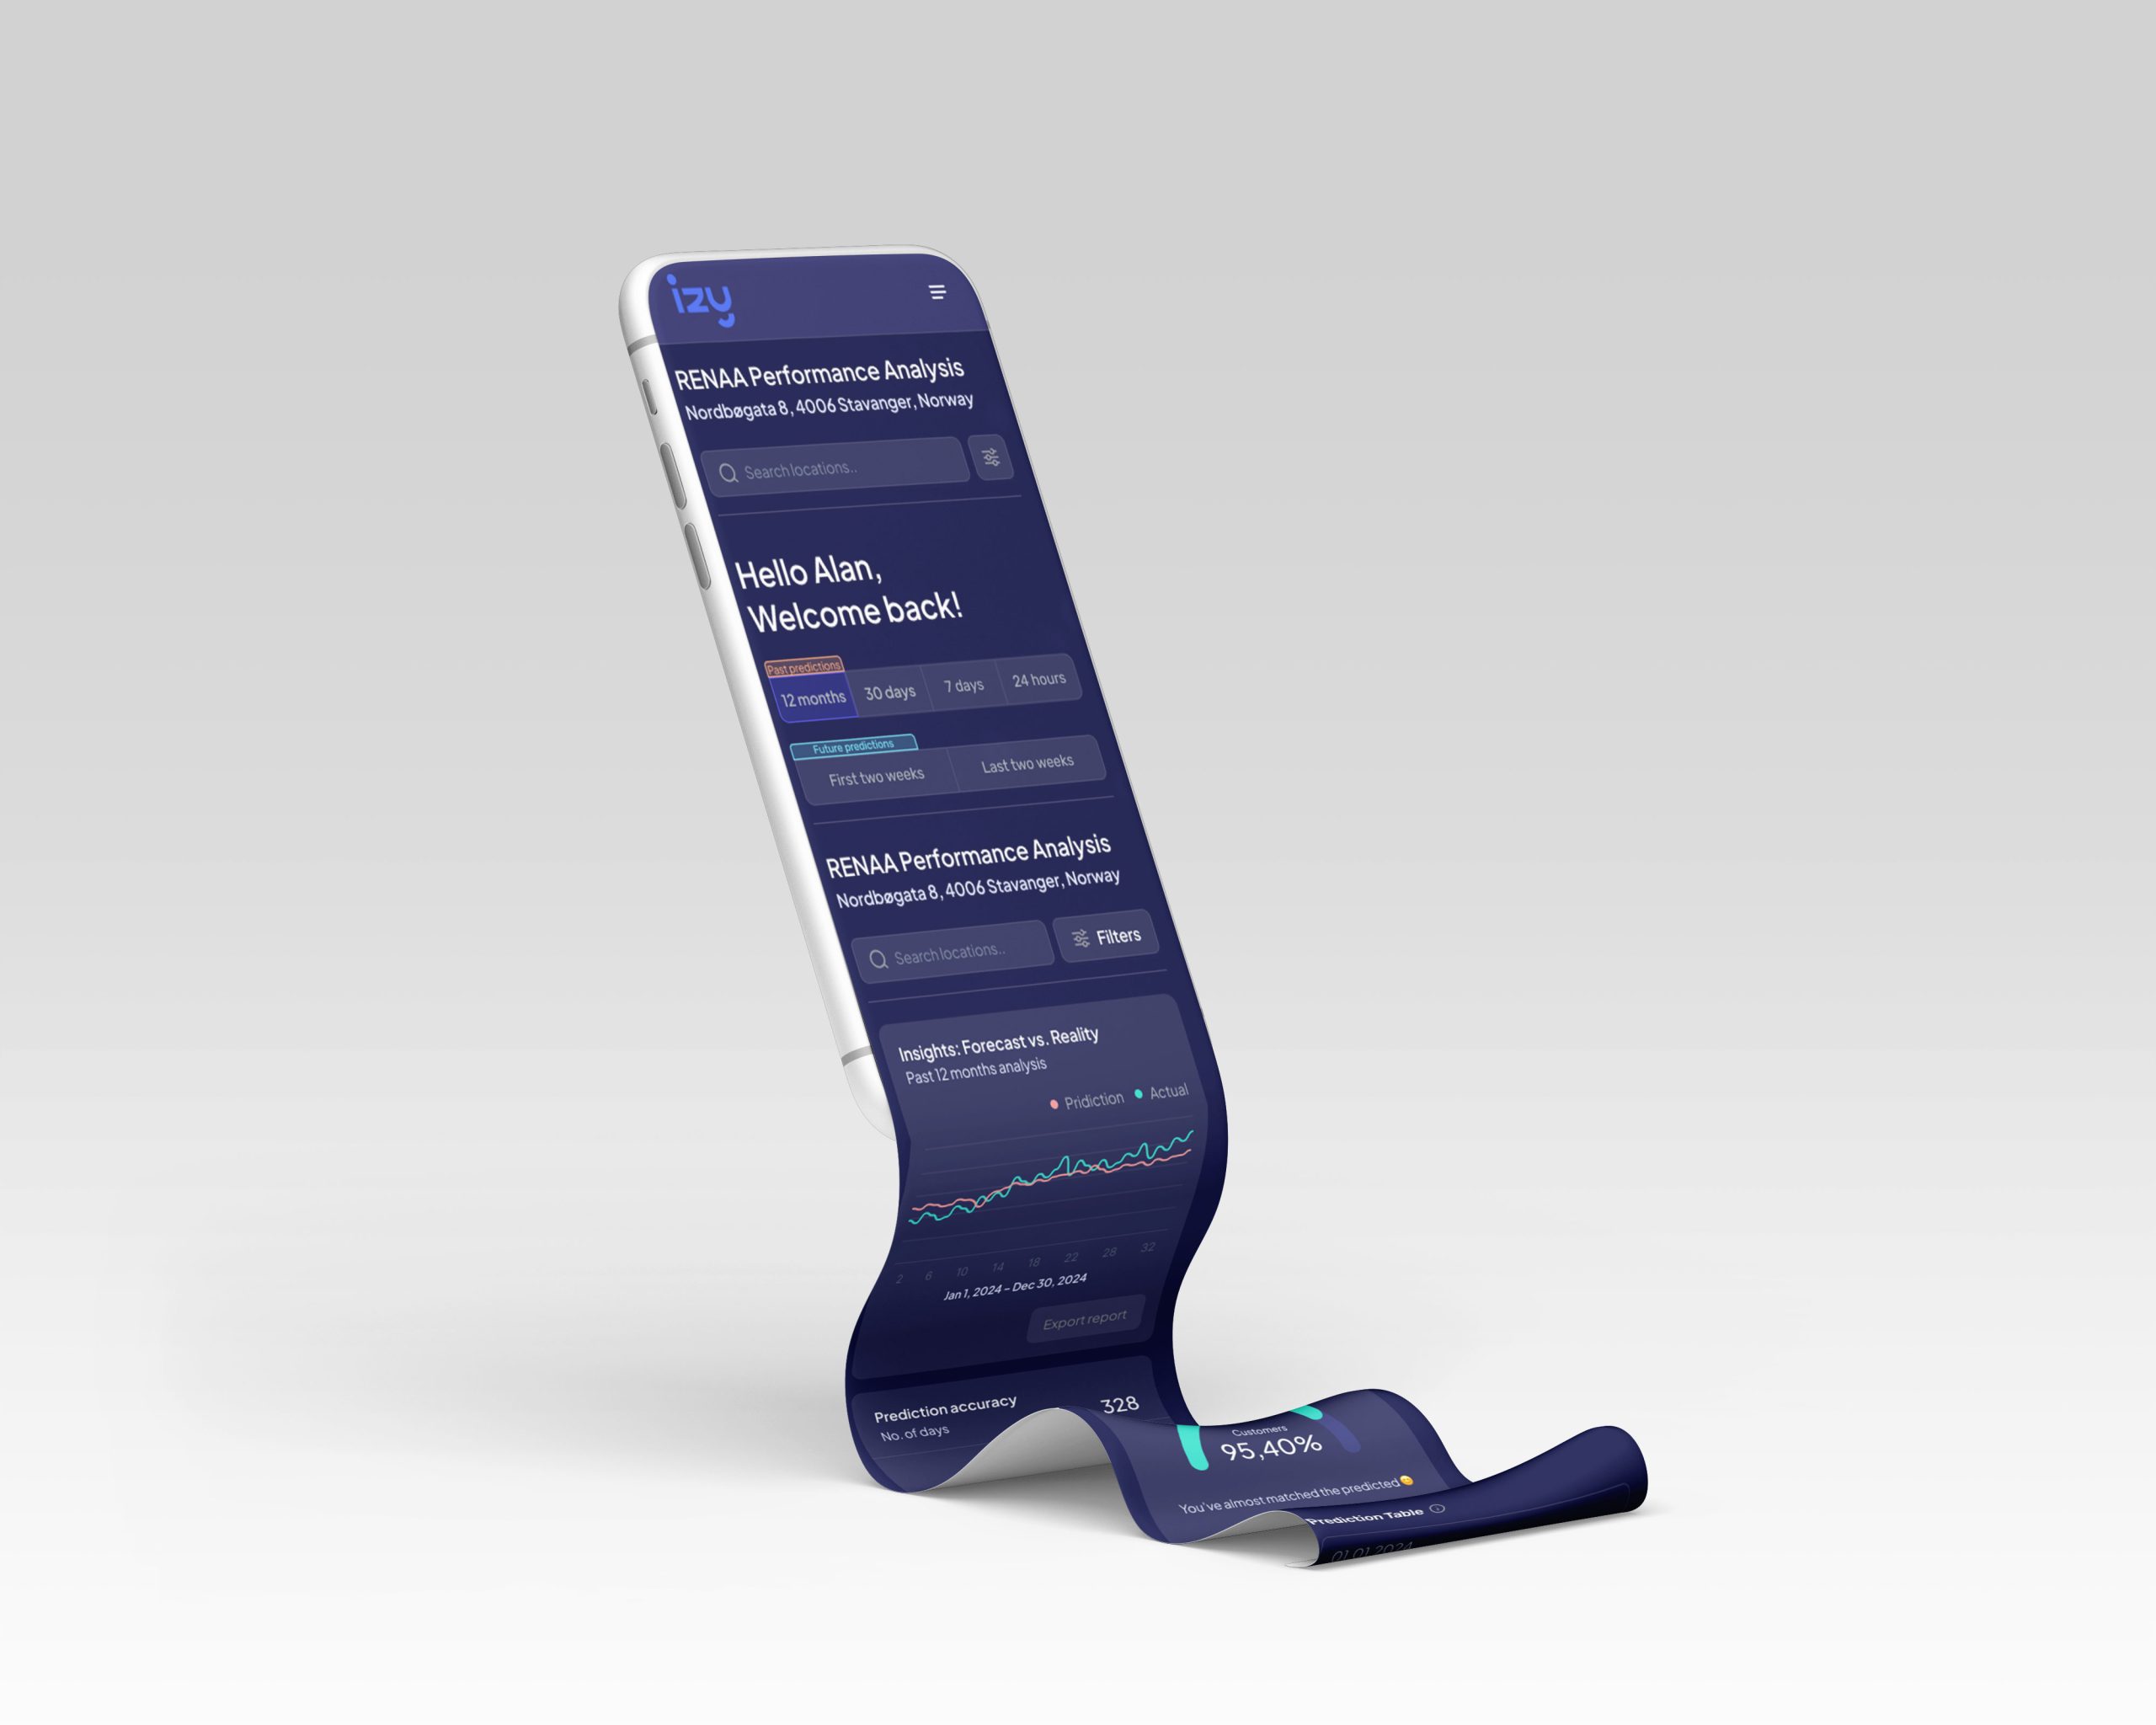
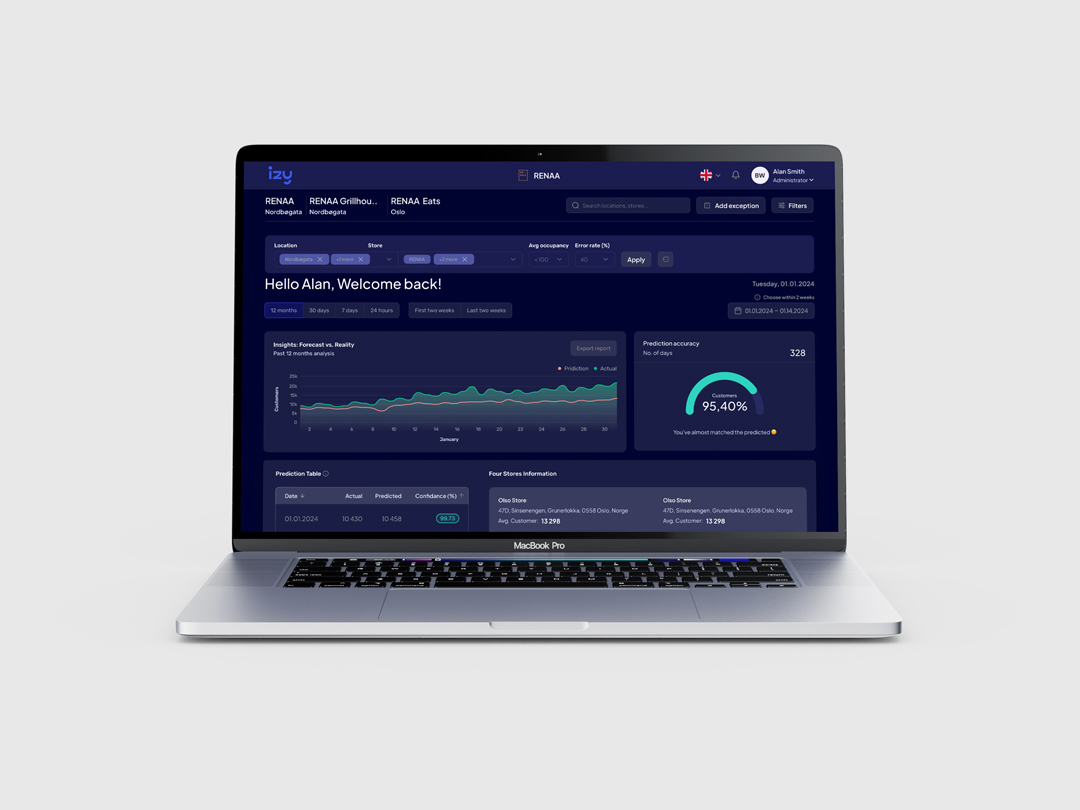
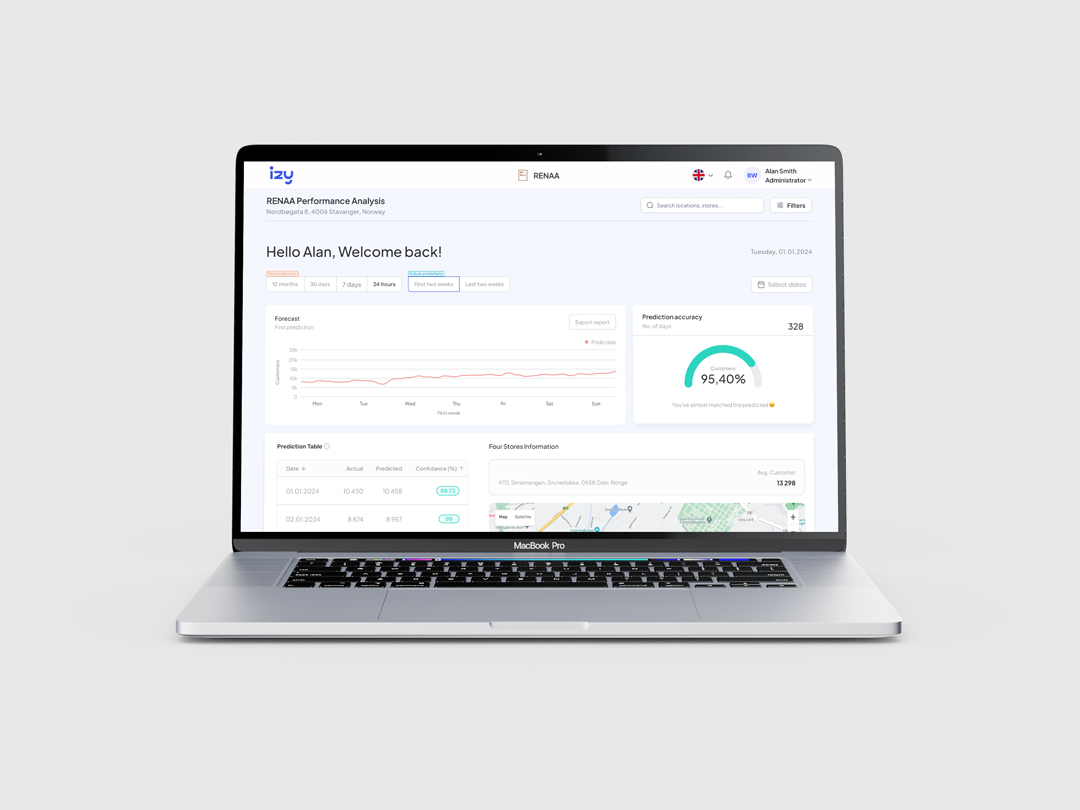
Design intuitive visualizations to display historical data, predicted values, and forecasted outcomes.
Implement interactive features to allow users to explore data at different time scales and levels of detail.
Ensure visual consistency with izy's overall design language.
Deliverables
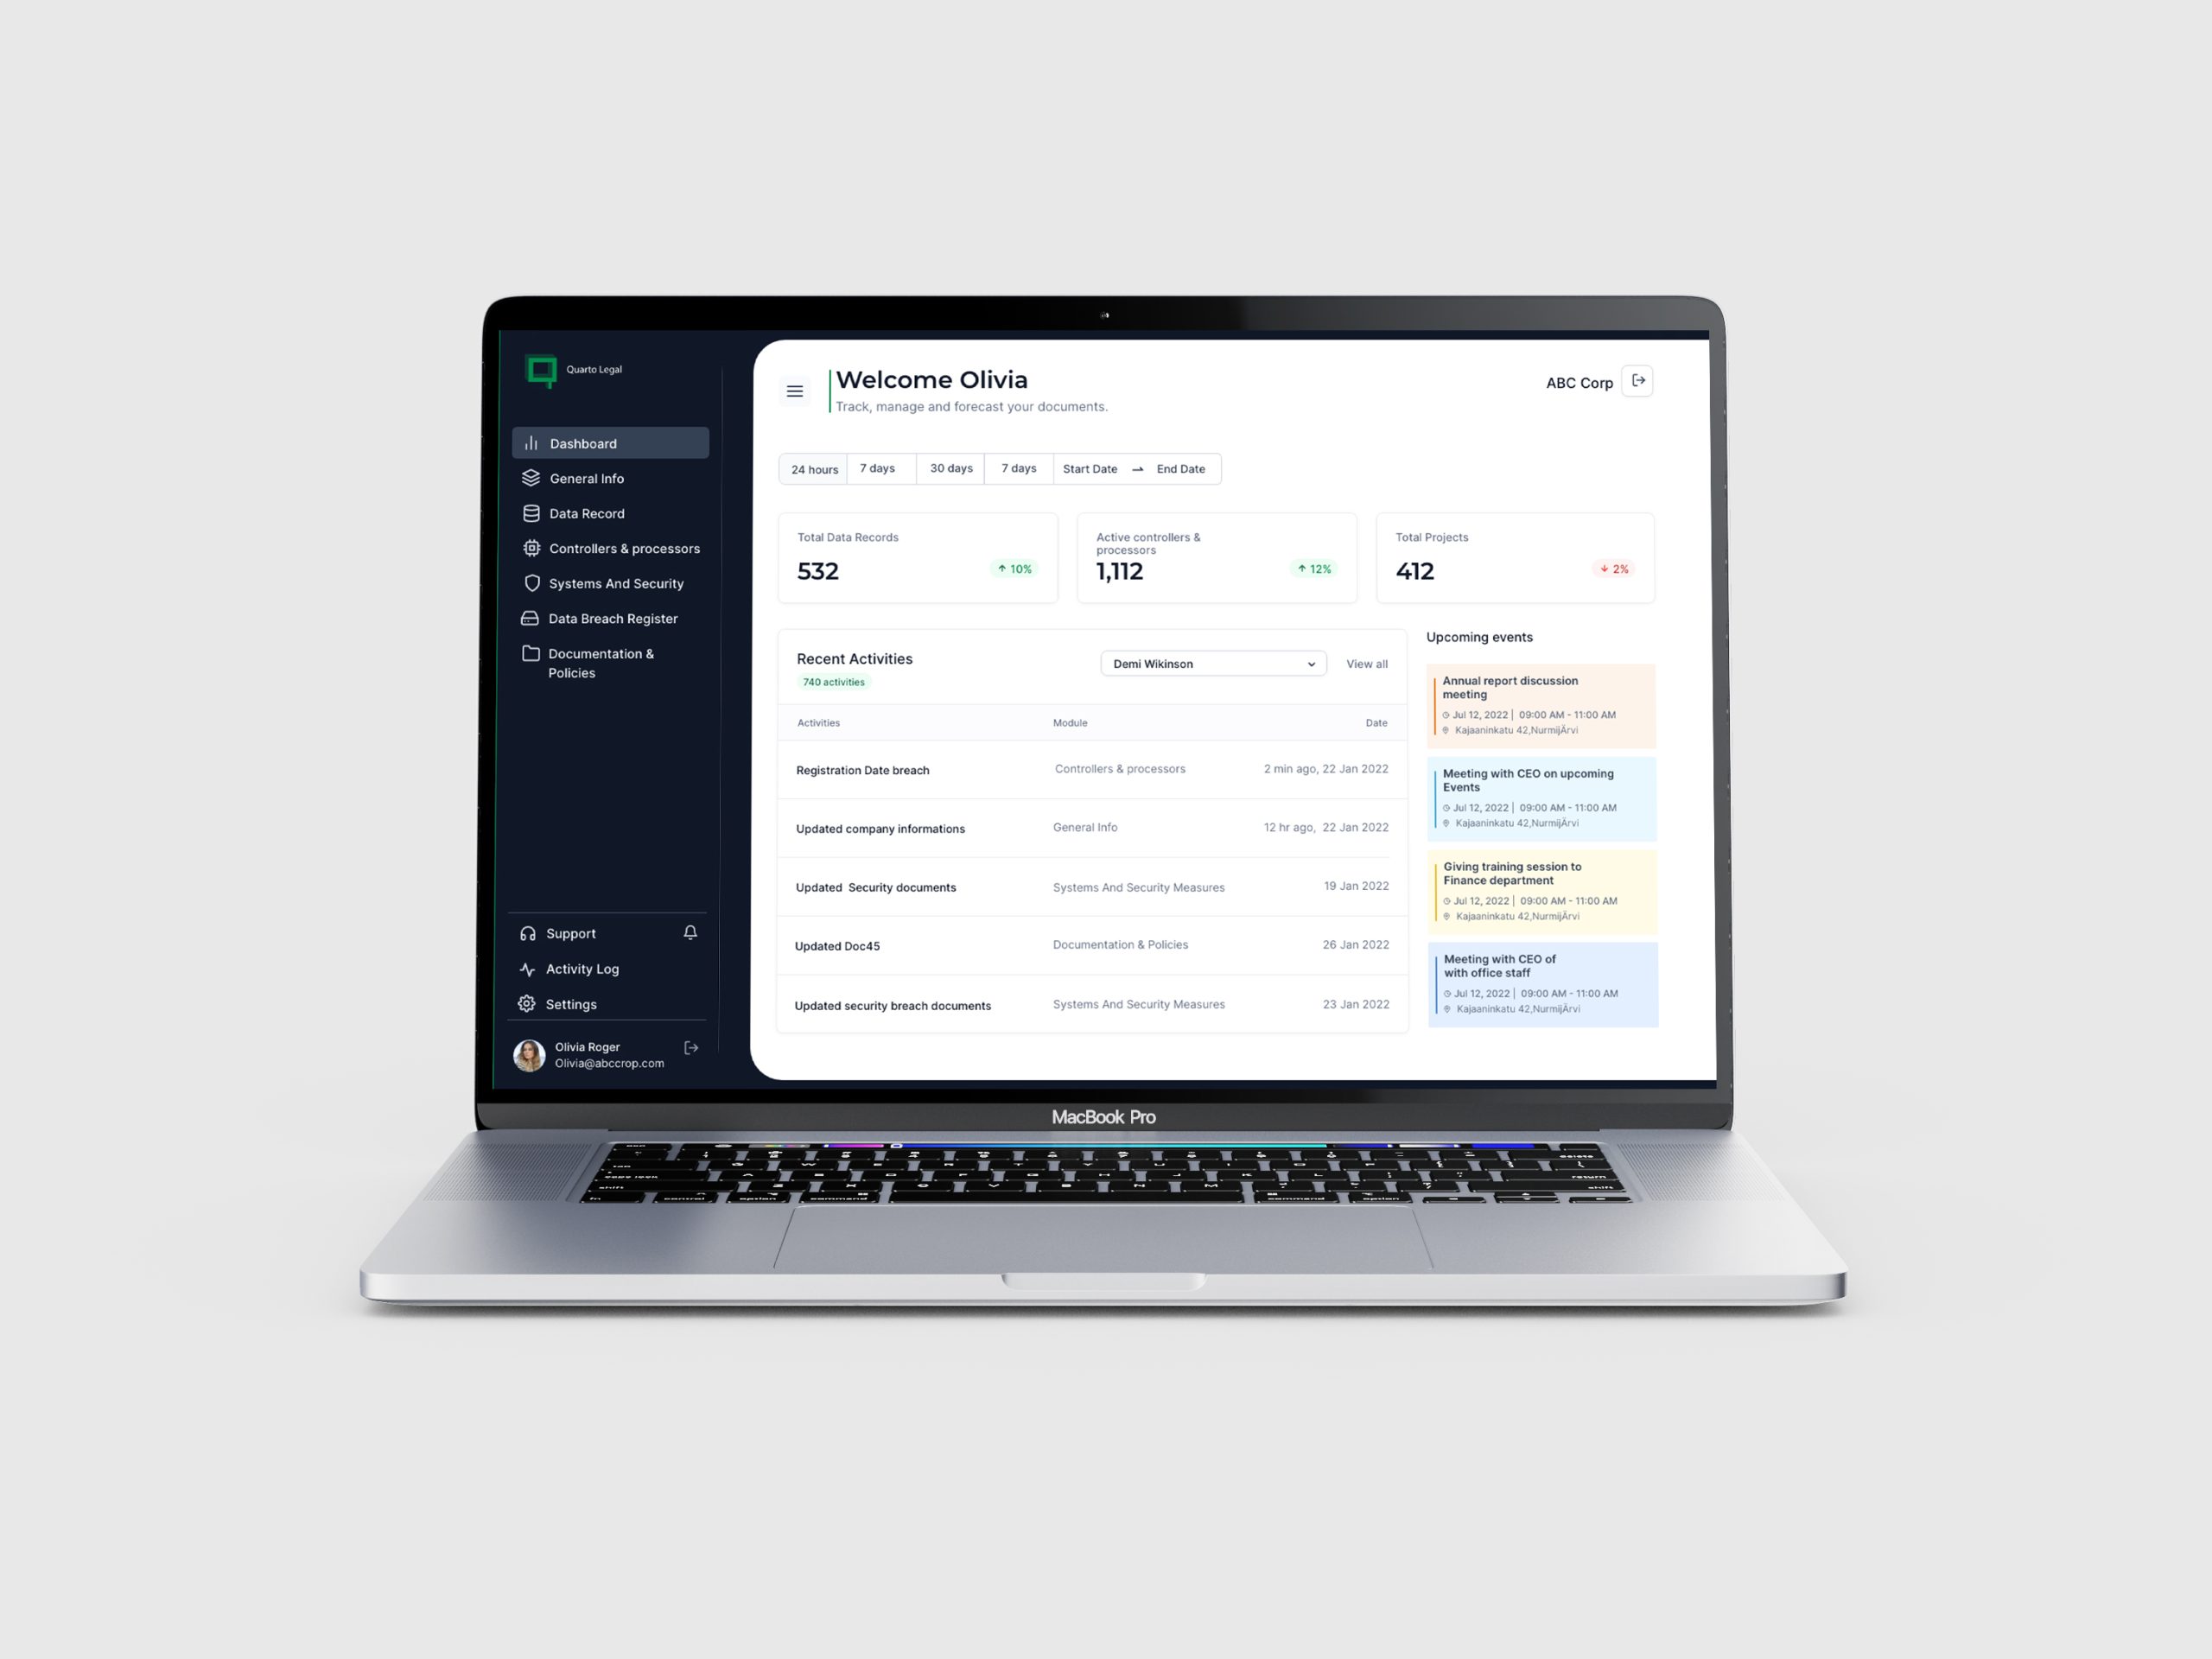
Data visualization mockups and prototypes.
Detailed design specifications and documentation.
Deliverables
High-fidelity wireframes and prototypes for each user interface.